

data insights
Where Science Meets Strategy: Revolutionizing Your Brands Presence
At HydrateNow, our advertising philosophy transcends traditional boundaries. Our data-driven approach that guarantees bringing in more customers and better business for you. Here's how we integrate science into our advertising strategies:
01
User Behavior Insights:
Understand when users are most likely to scan, how they navigate your landing page, and what content keeps them engaged — helping you tailor future campaigns to match real-world behavior.
02
Behavioral Economics:
Our advertising takes into account principles of behavioral economics, influencing consumer decision-making and driving desired actions.
03
Consumer Interaction Metrics:
Go beyond impressions. Measure how your audience interacts with your brand from the first scan to the final click.
04
Location -Specific Strategies:
We use a method called geospatial analysis to know where our audience is and foot traffic patterns, helping us create ads that are specific to different locations
05
A/B Testing and predictive modeling:
We’re always improving through A/B testing and predictive modeling. That means we try different strategies, learn from real-time results, and adjust based on what works best.
06
QR Code Analytics:
We track more than scans—we map the full user journey. From heatmaps to click paths, our analytics show where users engage, how they navigate, and what drives them to act.
What Can the QR Code Do?

QR Codes
Our QR codes do more than just link — they unlock data. Every scan gives you real-time insight into how users interact with your campaign It’s a seamless bridge between physical engagement and digital performance tracking.

HeatMaps
Our heatmaps do more than show location — they reveal opportunity gaps. By tracking where and when scans happen, we visualize engagement intensity across regions, turning audience movement into actionable marketing insight.
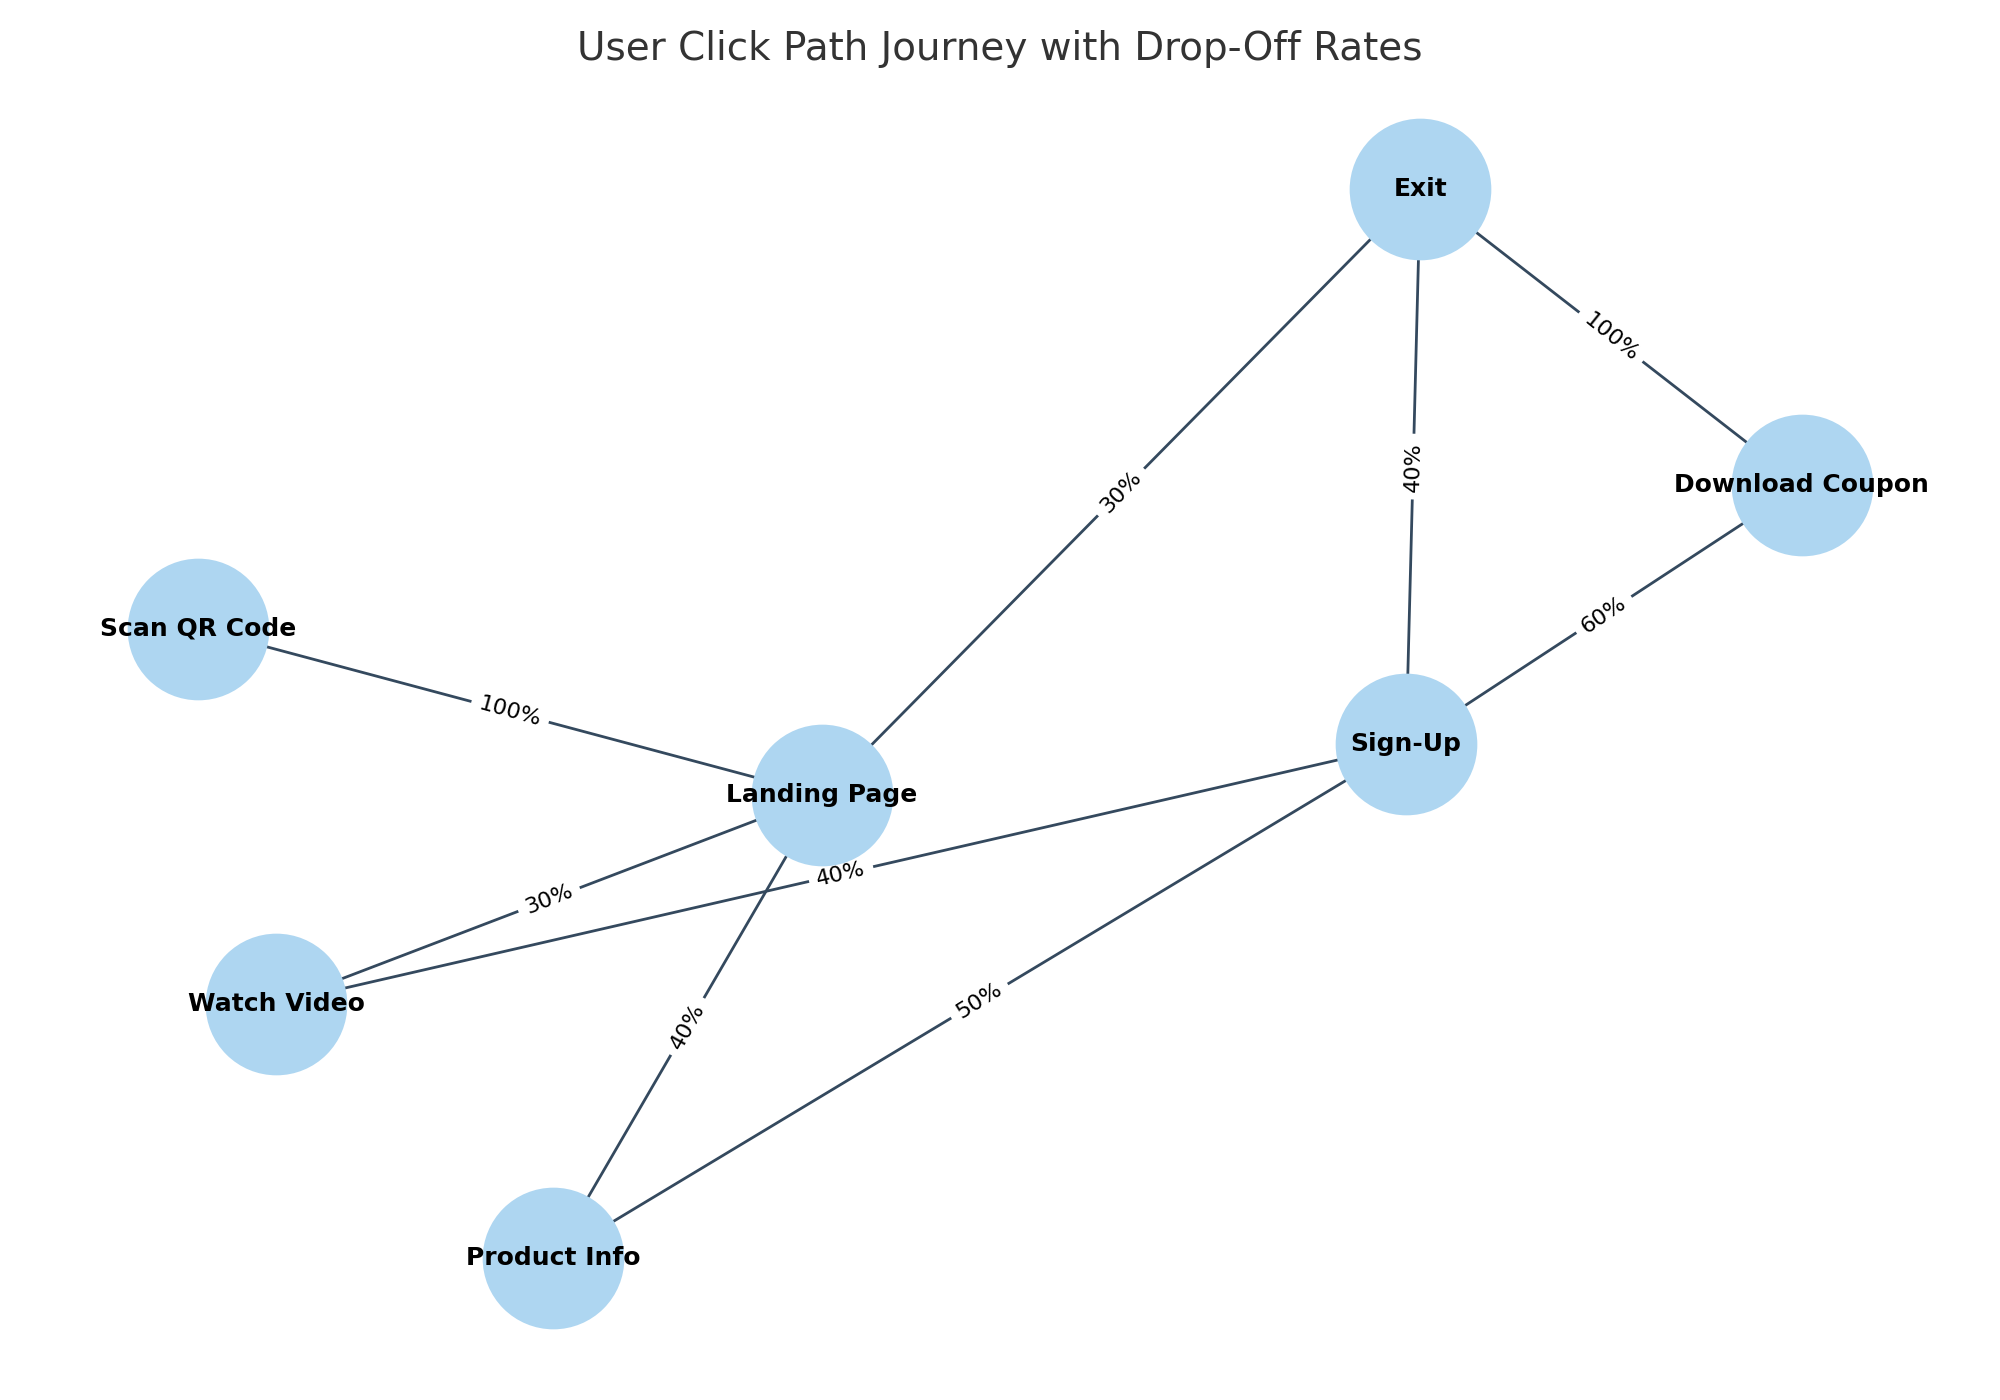
User Click Path Journey
Our user journey tracking goes beyond the scan — it maps behavior. From the first tap to the final action, we visualize how users navigate your content, uncovering drop-off points and revealing what drives conversion.
Key Performance Indicator’S
(Just some of our KPI’s)
300%
Impressions
Branded water bottles are carried throughout events and beyond, creating repeated visibility in a way traditional banners or flyers can’t match.
150 - 200%
Interactions
People are more likely to engage with something they're physically holding. QR codes on a useful item like a bottle invite curiosity and interaction.
100-150%
Engagement
The novelty of the experience and real-world value of the product leads to longer attention spans, more follow-through, and higher brand recall.